


How does the environment a child grows up in shape the way they learn languages?
Image downloaded from pexels.com by Pavel Daniyuk
For children in underserved communities, language development faces pressure from two directions at once: inside the home and from the neighborhood around it. Caregiver capacity, household income, access to stimulating environments. These don't operate in isolation; they compound.
I conducted independent research on that dynamic to understand what was actually driving outcomes, and what might be possible to change.
My role
Independent Researcher
Skills
Quantitative Analysis
Academic Writing
Timeline
Jun 2022 - May 2023
My contribution
I designed and ran this study end-to-end as an independent researcher — framing the question, selecting variables from the FFCWS (opens in a new tab) longitudinal dataset, cleaning the data in R and SPSS, and running both correlational analyses and a Bivariate Latent Change Score (BLCS) model to track how parental cognitive stimulation and child language outcomes shifted together between ages 3 and 5.
Impact & outcome
The analysis showed that children starting with lower language scores gained the most by age 5, and households with less cognitive stimulation at baseline saw the largest increases over the same period. A lower starting point didn't predict worse outcomes — it pointed to more room to grow, and shaped the design question for the follow-up project on early-literacy tools.
Part 1. Background
Research background
We've long known that the earliest years of a child's life are critical for language development. The concept of critical period, introduced by Werker and Hensch (2015), is defined as an open window when children are more responsive to environmental input and experience. How much a caregiver talks, reads, and engages with a child leaves a lasting imprint on how they learn to communicate (Stark & Heinz, 1996; Tsao et al., 2004).
But a child doesn't develop language in isolation of a single family. They develop it inside a web of relationships, spaces, and systems (Bronfenbrenner, 1999). Bronfenbrenner defined each individual person as a unit system and the relationship with other systems is dynamic. Hence, in the diagram,
- The core represents the individuals, such as children and parents;
- The middle ring represents the relationship between two unit systems, such as parent-child interactions.
- The outermost circle represents settings the person doesn't directly participate in but that affect them.
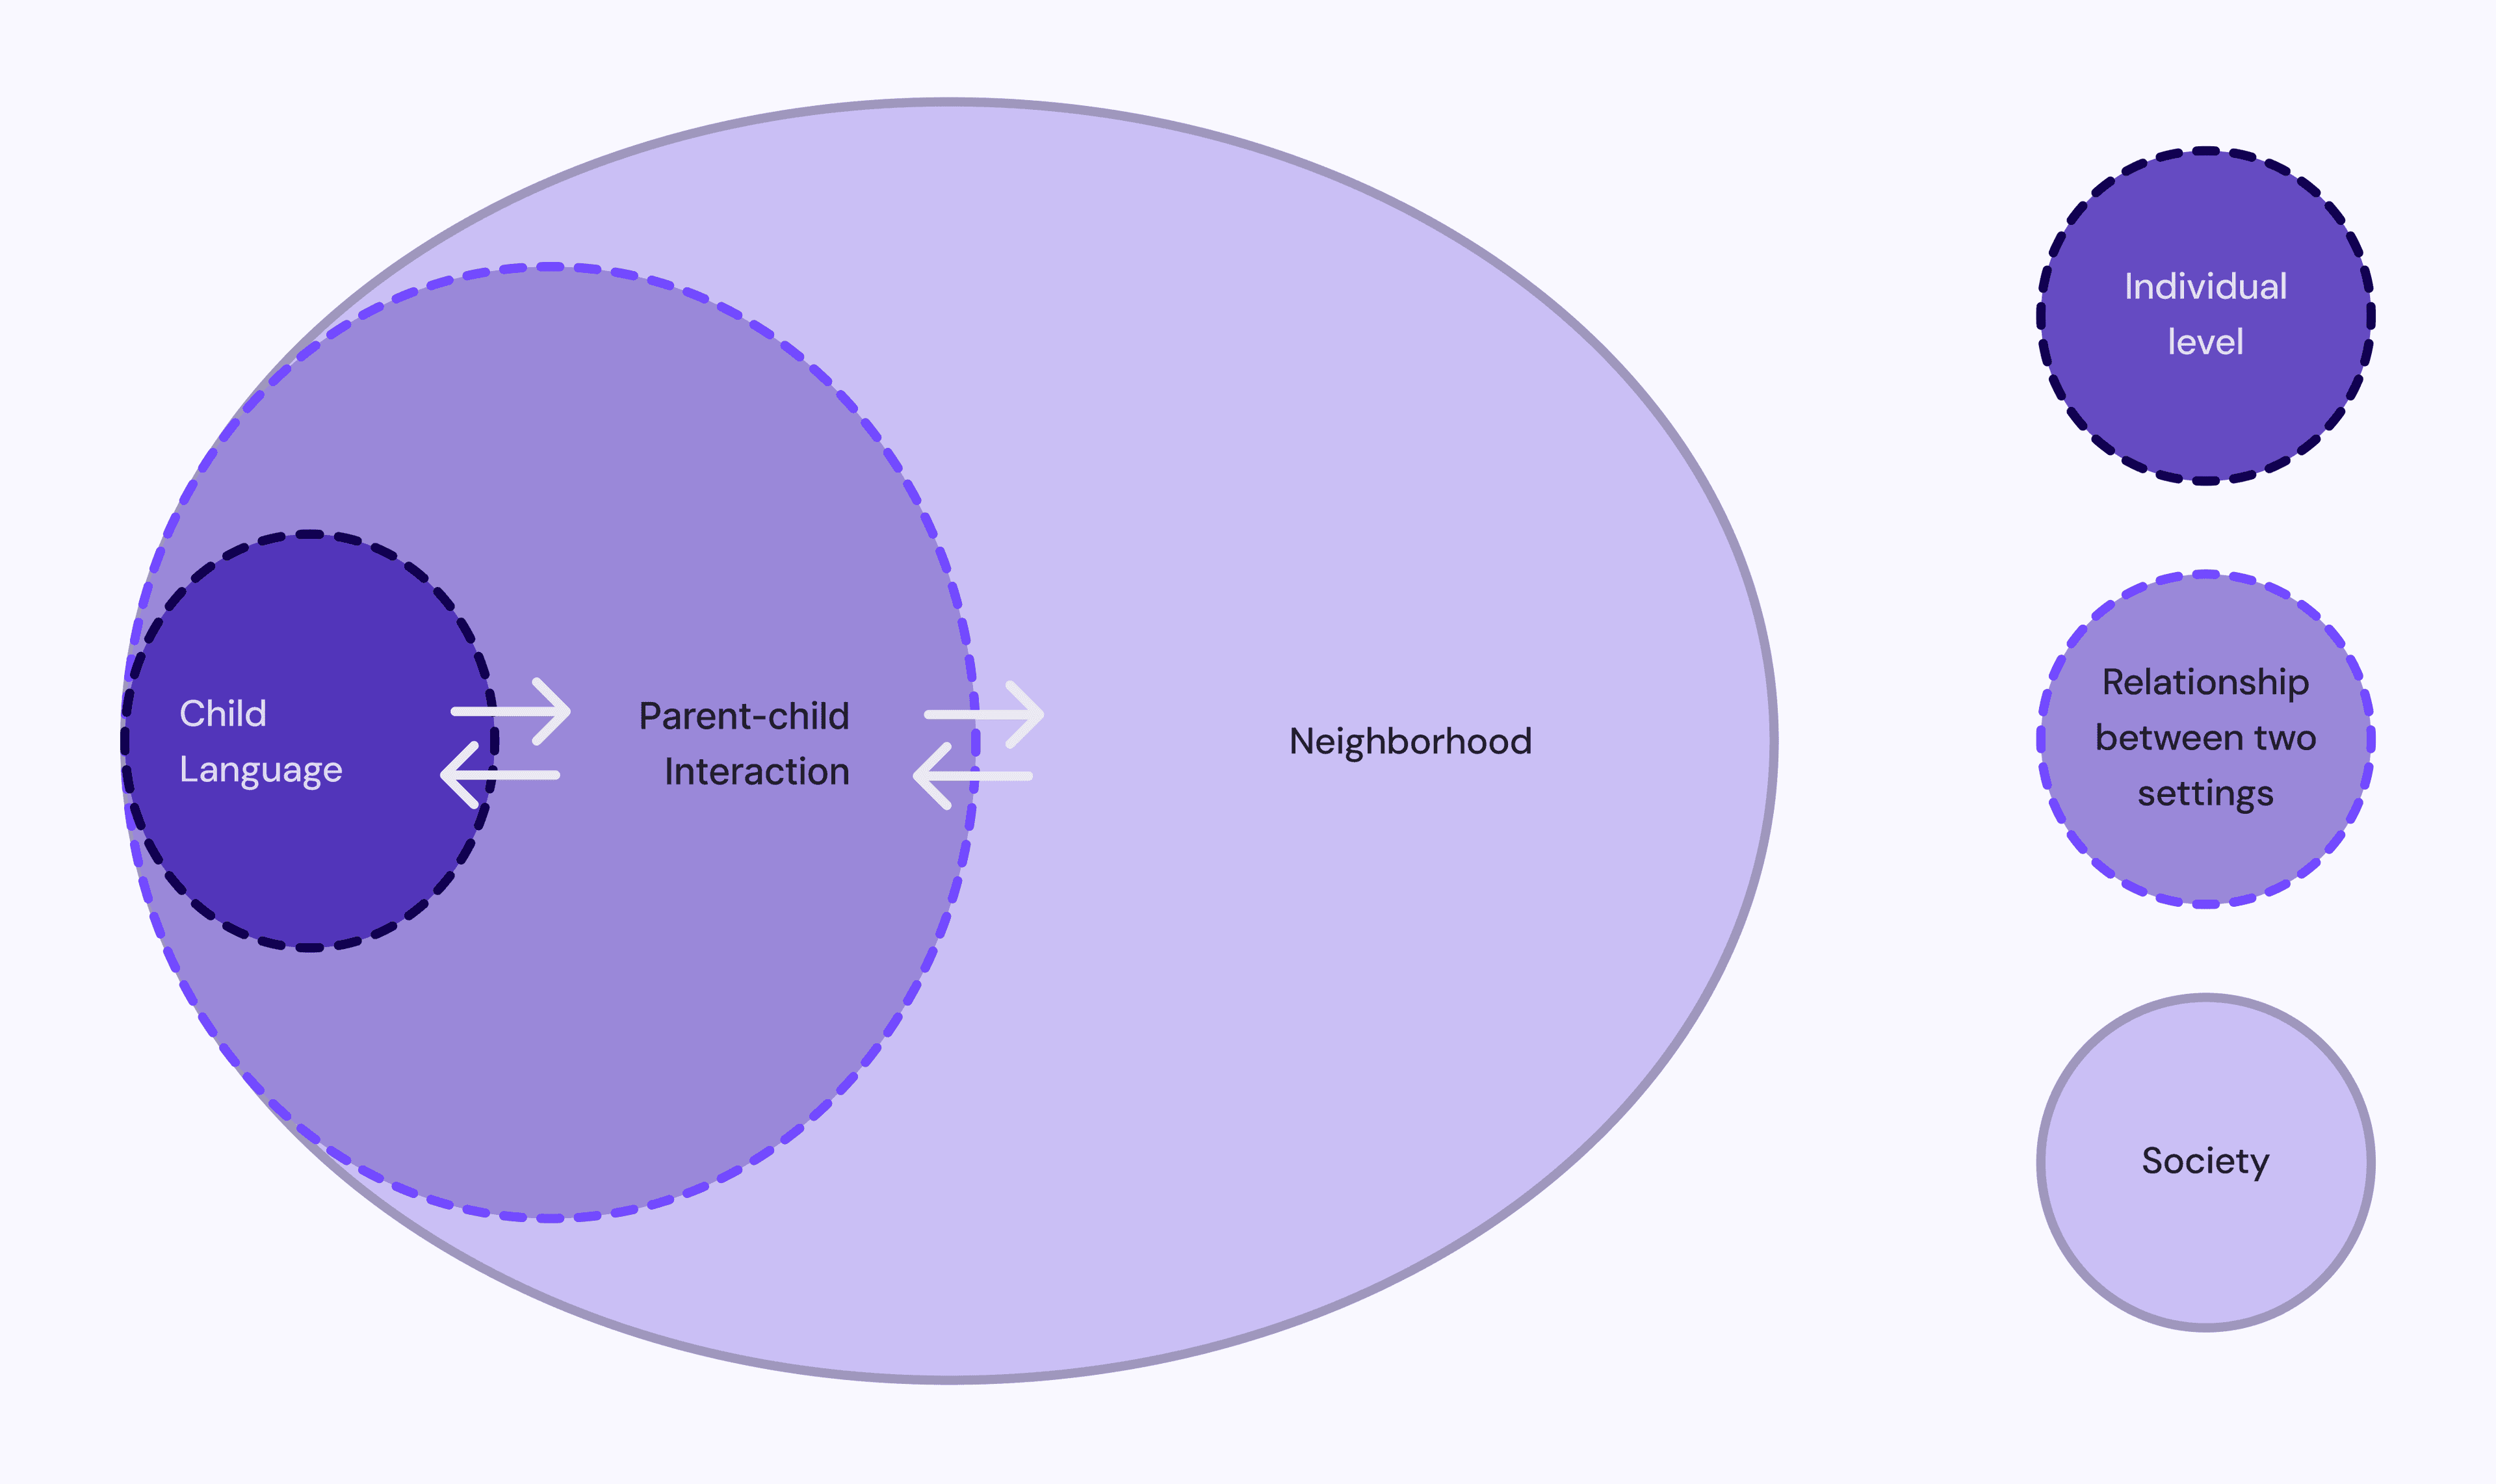
However, far less attention has been paid to what happens to families in less advantageous neighborhoods. It is found to be negatively associated with child language outcomes (Froiland et al., 2013).
Part 2. Objectives
Research objectives
The goal was to examine how the dynamic between parent-child interaction within the household. Specifically, how caregiver plays and talks to the child shapes child language development over time between the ages of 3 and 5 of children over time with a focus on low-income, racially diverse families.
I defined cognitive stimulation as a combined measure of how parents talk and play with their children and what learning resources the household has access to, capturing the direct interaction layer between caregiver and child. To isolate that dynamic, I focused the sample on underserved communities, keeping neighborhood context consistent across cases.
Therefore, I asked
To what extent do the parental cognitive stimulation predict child early language development within underserved communities?
Part 3. Methods
Research methods
Rather than collecting new data, I chose to work with an existing longitudinal dataset: the Future of Families and Child Wellbeing Study (FFCWS) (opens in a new tab), the longest-running national birth cohort study of its kind in the US, spanning children across more than 20 cities. As language development unfolds over years, the FFCWS gave me access to caregiver-child interaction data across waves, with enough geographic range to capture real variation in neighborhood conditions.
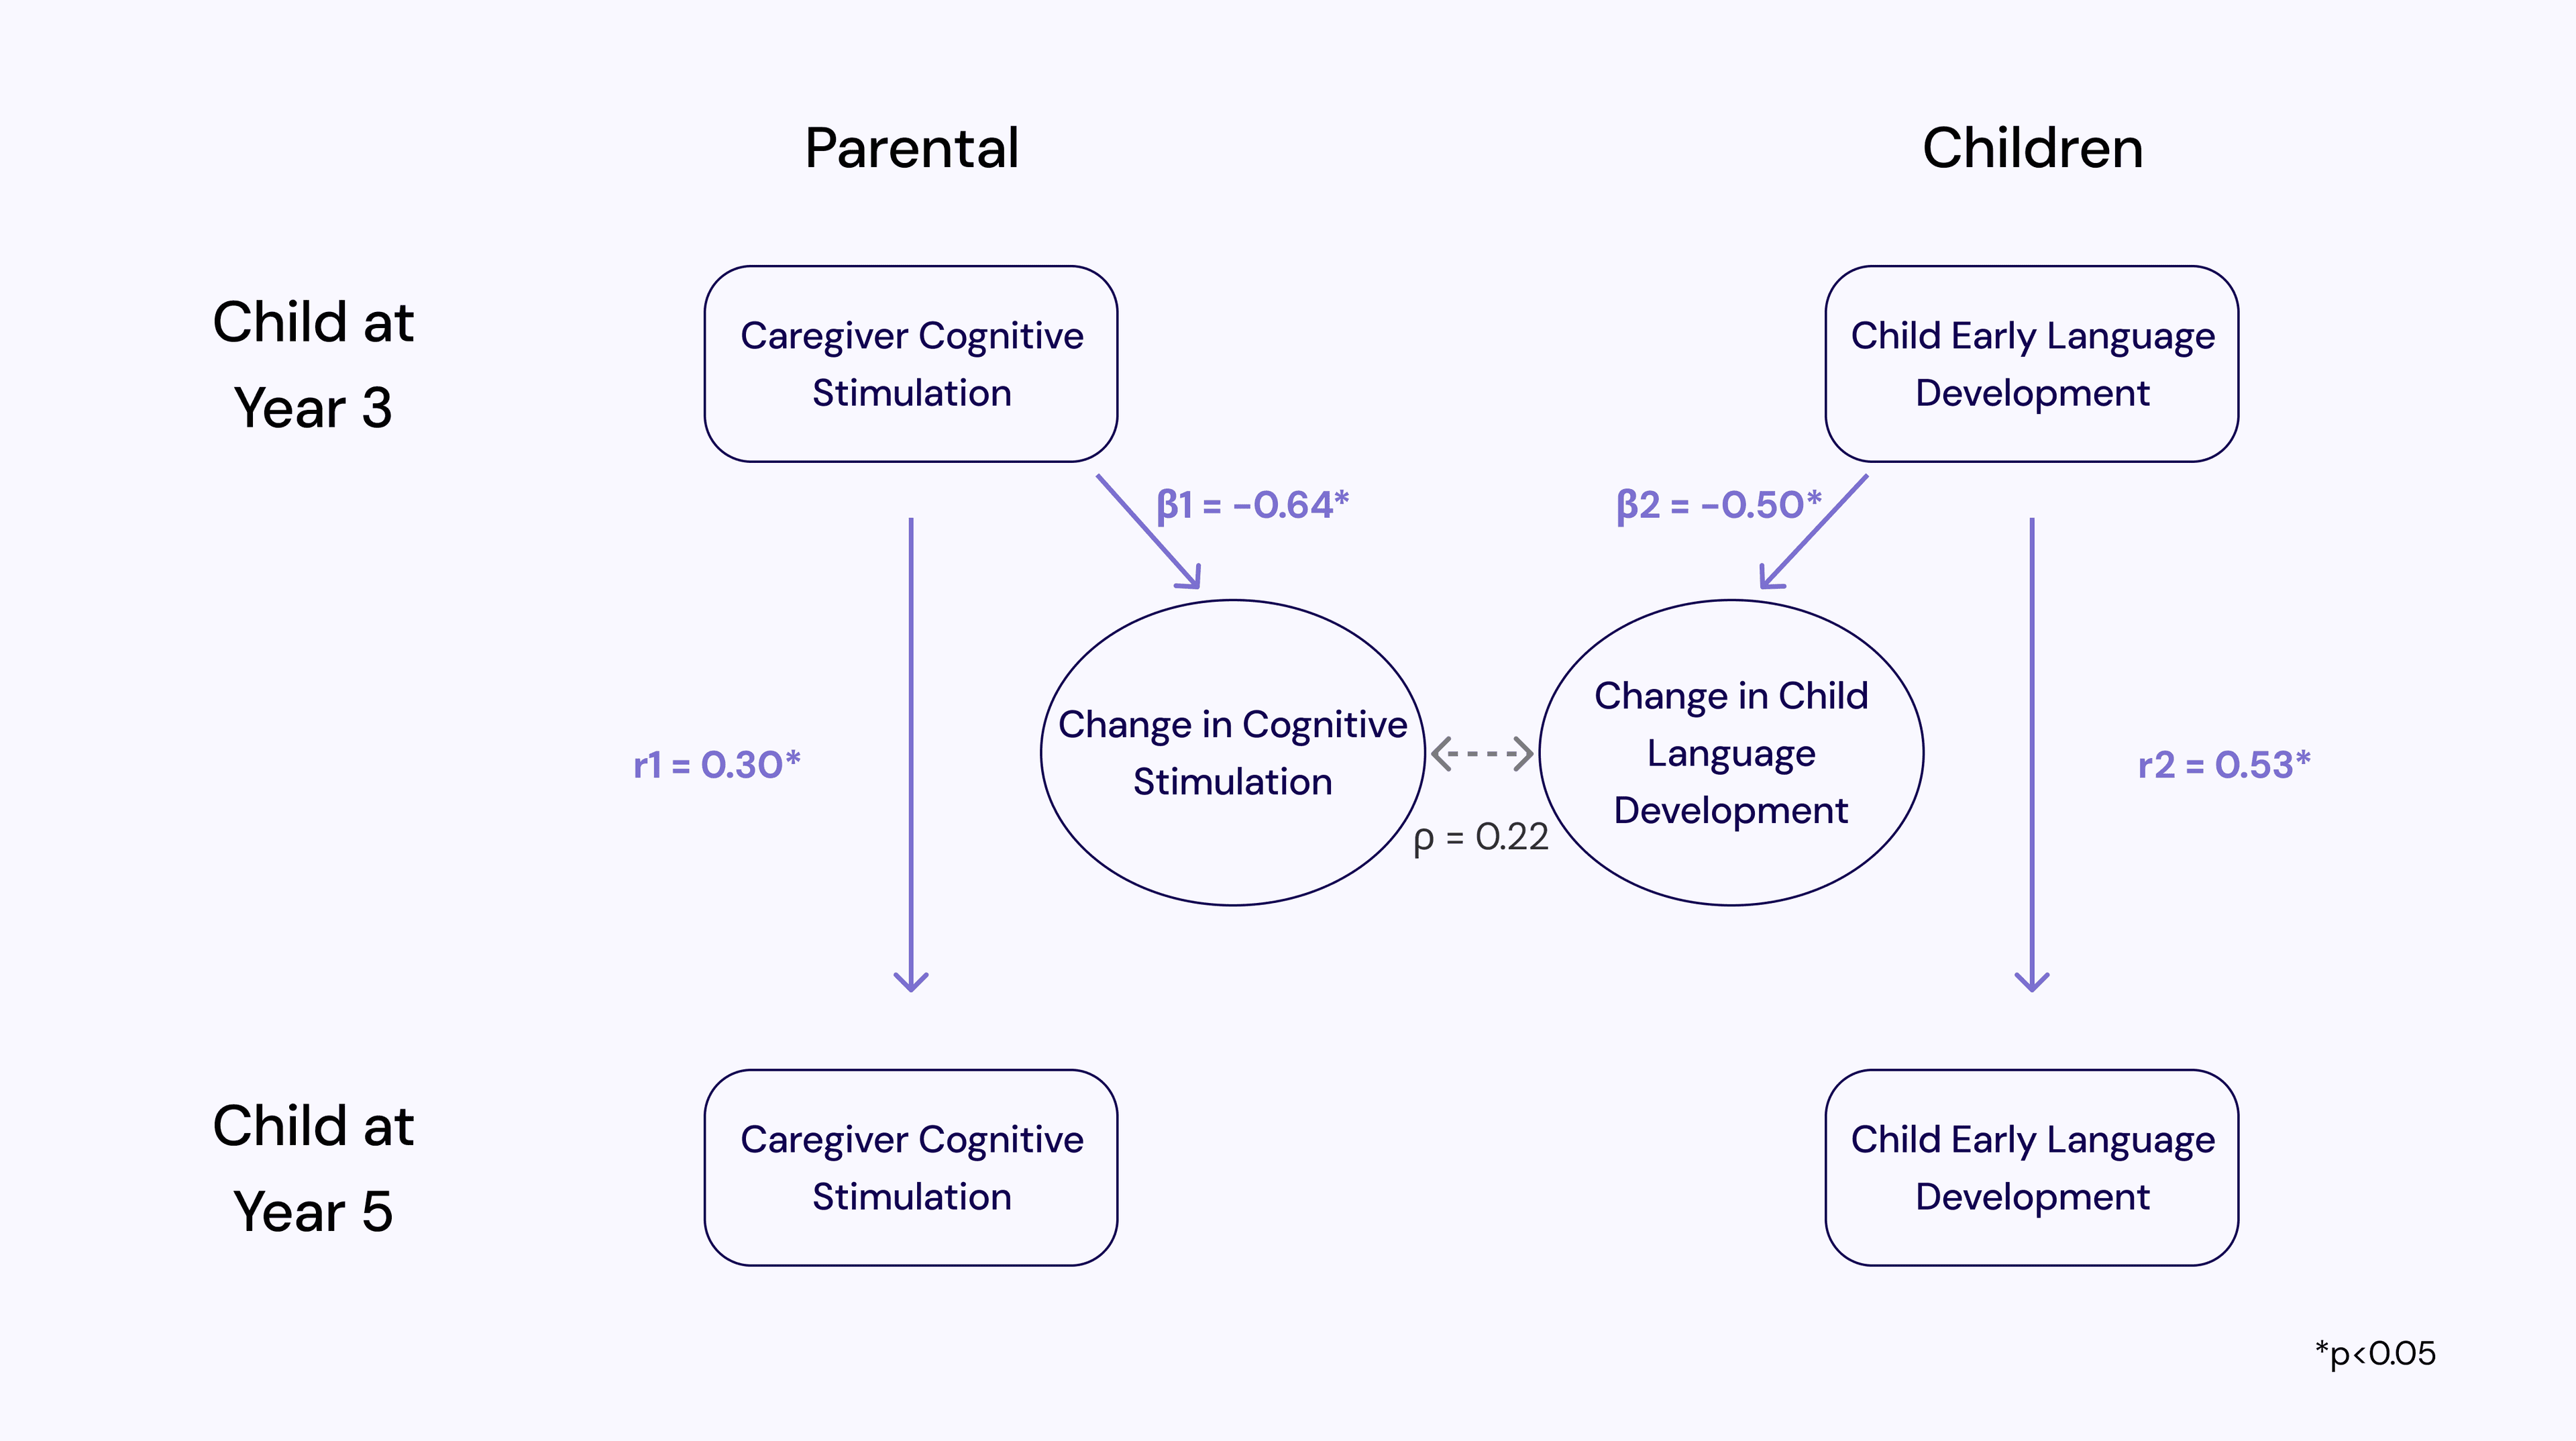
To analyze, I used correlational analyses to look into correlations between variables of interest and Bivariate Latent Change Score (BLCS) model to track how two variables change in relation to each other across time. Specifically, I investigated
- Correlation between child's gender and language development
- Correlation between household income and language development
- Correlation between caregiver education and language development
- Correlation between the changes of parental cognitive stimulation and changes of child language outcome.
The use of two different methods distinction mattered: the goal wasn't only to show correlation at a snapshot, but to test whether shifts in cognitive stimulation predicted shifts in language outcomes.
Due to various aspects of a kid's needs at different stages, there are only a few overlapping between the age of 3 and 5. Therefore, I selected the variables of access to toys, books, and musical instruments as markers of an environment built to engage a child's mind and questions regarding vocalization from parents to kids between the ages of 3 and 5.
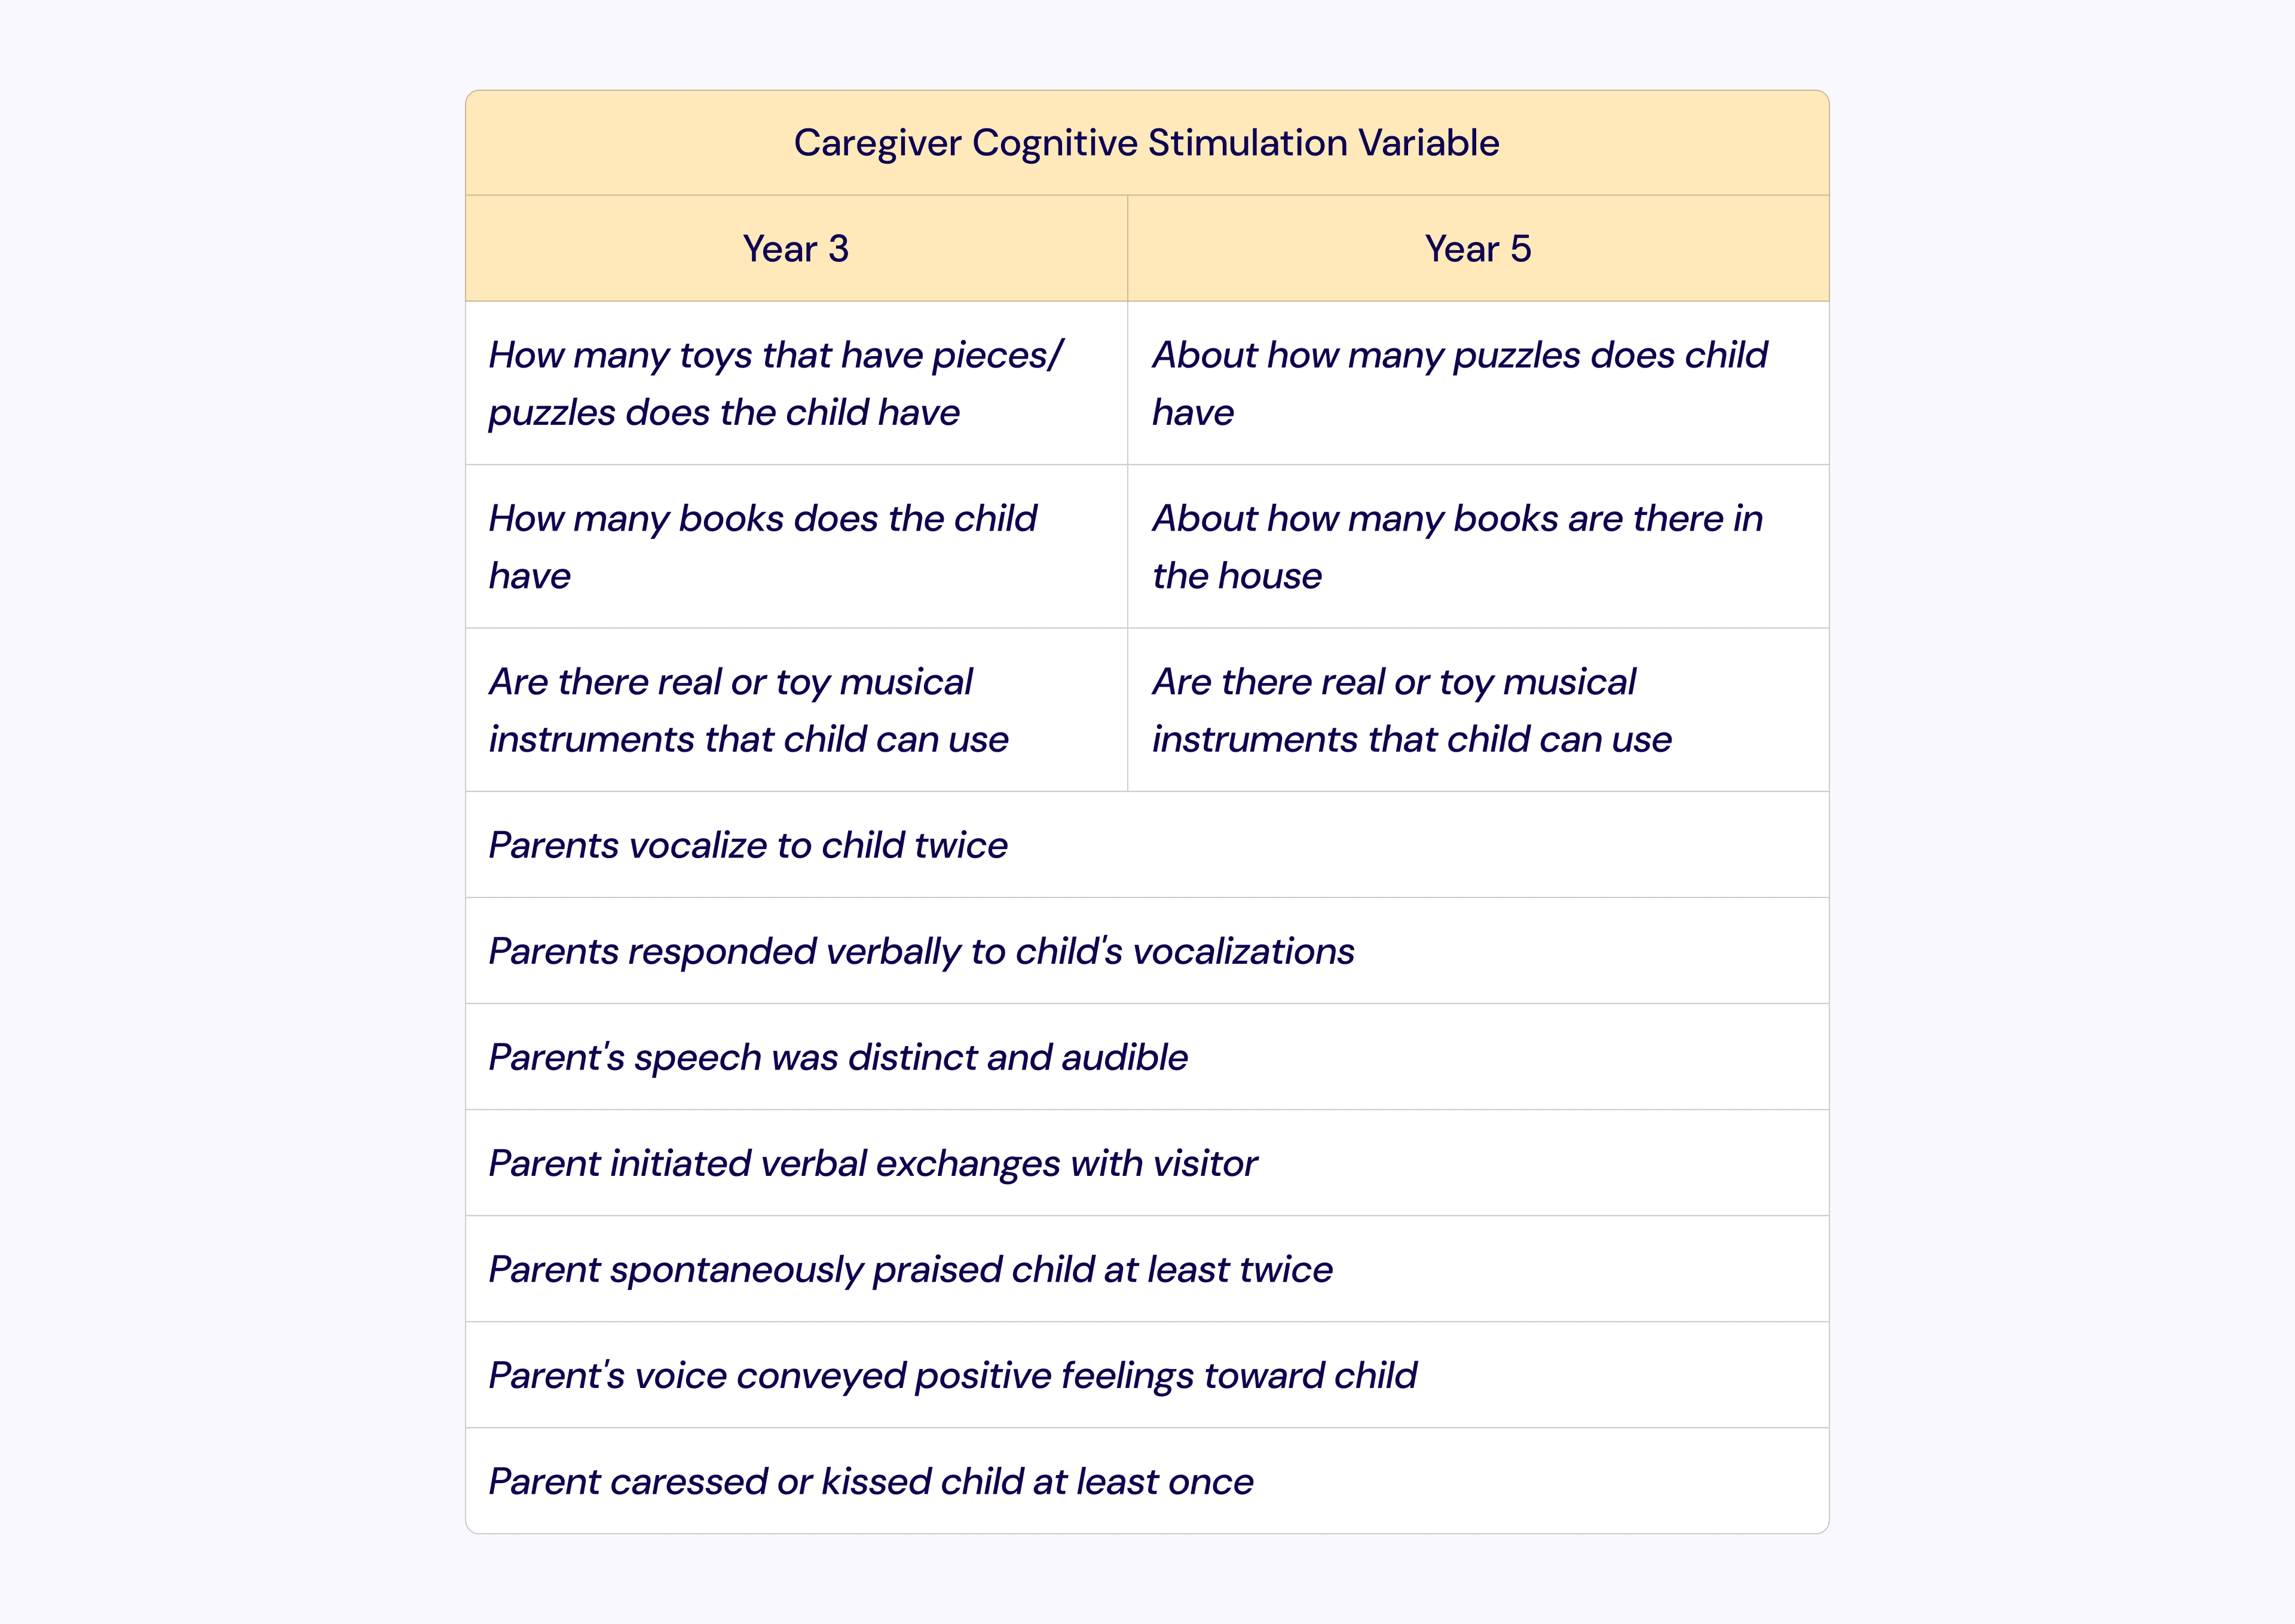
Later, I cleaned the data and ran the analysis in R and SPSS. You can find more details about the analysis here (opens in a new tab).
Part 4. Findings
Research finding
From correlational analysis, data shows that the household income and caregiver education level both exhibit positive correlations with child language outcomes. That is,
- The higher the household income is, the better the child language performance is
- The higher the education that the caregiver has acquired, the better the child language performance is.
This is consistent with the previous findings (Froiland et al., 2013). The bivariate latent change score model revealed something more interesting:
- Children who started Year 3 with lower language scores showed greater gains by Year 5
- Children whose caregivers provided less cognitive stimulation at Year 3 showed larger increases in stimulation over the same period.
In other words, a lower starting point didn't mean worse outcomes. It meant more room to grow.
For children growing up in a less advantageous environment, it would be helpful to study the factors that could buffer the negative effects from adverse childhood experience in terms of policy changing. The findings that children with lower starting level of language outcome can improve more have suggested that they have more potential in their development.
Part 5. Reflection
Reflection
The most honest limitation of this study is the variables available to me. I could only use the three measures that overlapped between the age 3 and age 5 waves of the dataset: access to toys, books, and instruments and basic communication style between parent and children. That's a narrow window into what cognitive stimulation actually looks like in a household.
If I were to extend this work, I'd like to collect more granular data on stimulating activities, and pairing it with on-site observation to understand the texture of the home environment beyond what a survey can capture, including things like how often a caregiver reads with their child, whether conversations are led by the parent or the child, and what daily routines look like in practice.
Part 6. What's next
What's next
The research kept pointing to the same gap: potential exists, but the right tools don't always follow. That gap is what I set out to close in the next project.
References
Bronfenbrenner, U. (1999). Environments in developmental perspective: Theoretical and operational models.
Froiland, J. M., Powell, D. R., Diamond, K. E., & Son, S. C. (2013). Neighborhood socioeconomic well‐being, home literacy, and early literacy skills of at‐risk preschoolers. Psychology in the Schools, 50(8), 755–769.
Stark, R. E., & Heinz, J. M. (1996). Perception of stop consonants in children with expressive and receptive-expressive language impairments. Journal of Speech, Language, and Hearing Research, 39(4), 676–686.
Tsao, F., Liu, H., & Kuhl, P. K. (2004). Speech perception in infancy predicts language development in the second year of life: A longitudinal study. Child Development, 75(4), 1067–1084.
Werker, J. F., & Hensch, T. K. (2015). Critical Periods in Speech Perception: New Directions. Annual Review of Psychology, 66(1), 173–196. https://doi.org/10.1146/annurev-psych-010814-015104